
-
-
Trending searches: Internal gear pump | Double internal meshing gear pump | Gear pump manufacturer | Drilling and Tapping Center | Vertical hydraulic lathe
-
+86 13689586926
+86 13689586926
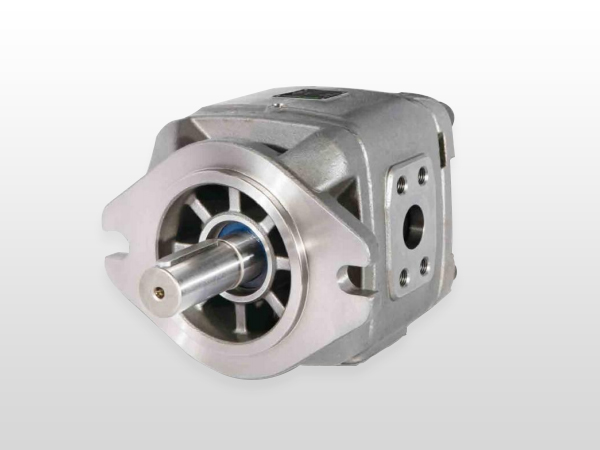
The performance curves of an internal gear pump describe the relationship between the pump's performance and parameters such as pressure, flow rate, and rotational speed. These curves help us understand the pump's operating characteristics, performance, and application scope. Below, using HG0/HG1/HG2 internal gear pumps as examples, we will explain in detail the meaning and reading methods of these performance curves.
Pressure-Flow Curve (P-Q Curve)
The pressure-flow curve illustrates the relationship between the output pressure (P) and the flow rate (Q) of an internal gear pump. As shown in the graph, the output pressure gradually decreases as the flow rate increases. This is because the operating principle of internal gear pumps dictates a certain restrictive relationship between output pressure and flow rate. When the flow rate increases, the degree of gear meshing decreases, and the rate at which the sealed volume increases slows down, resulting in a drop in output pressure.
Additionally, different pump models exhibit different pressure-flow curves. HG0 pumps have a lower starting pressure, making them suitable for low-pressure, high-flow applications. In contrast, HG1 and HG2 pumps feature higher starting pressures and a wider flow range, making them ideal for high-pressure, high-flow applications.
Rotational Speed-Flow Curve (n-Q Curve)
The rotational speed-flow curve describes the relationship between the pump's rotational speed (n) and its flow rate (Q). As shown in the graph, the flow rate increases correspondingly with an increase in rotational speed. This is because the flow rate of an internal gear pump is directly proportional to its rotational speed; the higher the speed, the faster the gear meshing frequency, and consequently, the greater the output flow.
Furthermore, different pump models display distinct rotational speed-flow curves, indicating that their flow rates respond differently to changes in speed. For example, HG2 pumps exhibit relatively minor flow fluctuations when the rotational speed changes, demonstrating superior steady-state performance. Conversely, HG0 pumps experience more significant flow variations with speed changes, making them suitable for applications where high flow stability is not strictly required.
Viscosity-Flow Curve (μ-Q Curve)
The viscosity-flow curve depicts the relationship between fluid viscosity (μ) and the flow rate (Q). As shown in the graph, the flow rate gradually decreases as viscosity increases. This is because the flow rate of an internal gear pump is closely related to fluid viscosity. Higher viscosity creates greater resistance to gear meshing and slows the expansion of the sealed volume, thereby reducing the output flow.
Moreover, different pump models exhibit varying viscosity-flow curves, showing different degrees of flow fluctuation under changing viscosity conditions. For instance, HG1 and HG2 pumps maintain relatively stable flow rates despite viscosity changes, making them suitable for applications with strict flow stability requirements. On the other hand, HG0 pumps are more sensitive to viscosity changes and are better suited for applications with lower flow stability requirements.
Temperature-Flow Curve (T-Q Curve)
The temperature-flow curve illustrates the relationship between the pump's operating temperature (T) and its flow rate (Q). As shown in the graph, the flow rate gradually increases as the temperature rises. This occurs because internal gear pumps generate heat during operation, raising the temperature of the fluid inside. As the temperature increases, the fluid's viscosity decreases, improving its fluidity and thereby increasing the output flow.
Additionally, different pump models show distinct temperature-flow curves, indicating varying degrees of flow fluctuation under changing operating temperatures. For example, HG1 and HG2 pumps maintain relatively stable flow rates despite temperature fluctuations, making them suitable for high-stability applications. In contrast, HG0 pumps experience more significant flow variations with temperature changes and are better suited for applications where flow stability is less critical.
Conclusion
In summary, the performance curves of internal gear pumps provide valuable information that helps us understand and evaluate the pump's performance characteristics and application scope. In practical applications, appropriate pump models and operating parameters can be selected based on specific working conditions and performance requirements. Furthermore, by reading and analyzing these performance curves, we can continuously optimize and improve the pump's performance.
Building 7, Jinba Technology Park, No. 2 Dongsheng Industrial Road, Fenggang Town, Dongguan City, Guangdong Province
Follow us

 Chinese
 English
 >
>